
Market volatility correlation is a statistical measure that evaluates the relationship between the volatility or returns of two or more financial assets, indices, or markets over time. It indicates whether assets tend to experience price fluctuations simultaneously, move in opposite directions, or behave independently. Rather than focusing solely on whether prices rise or fall, market volatility correlation examines whether uncertainty itself is shared across assets.
A critical distinction for students is between price direction and volatility. Price direction reflects gains or losses, while volatility in the stock market reflects the intensity, dispersion, and frequency of those movements. Correlation analysis can be applied to returns, volatility measures, or both, depending on the analytical objective. Two assets may have low return correlation yet exhibit high volatility correlation, meaning their prices move independently but become unstable at the same time.
In financial analysis and trading, market volatility correlation helps explain co-movement risk. When correlations are high, diversification benefits decline, especially during periods of market stress. As a result, correlation serves as a foundational tool for understanding how risk is distributed and transmitted within financial markets.

Why Market Volatility Correlation Matters
Market volatility correlation is a critical concept for understanding how financial risk is generated, distributed, and amplified within portfolios and across broader financial systems. In modern markets, assets are linked through shared macroeconomic drivers, investor behavior, liquidity conditions, and institutional constraints. As a result, volatility in the stock market rarely remains confined to a single security or sector. Market volatility correlation explains whether shocks to one asset are likely to coincide with, offset, or remain independent from shocks to others.
For students of finance, this concept is essential because it reveals why apparent diversification may fail and why risk management must focus on relationships between assets rather than on individual securities in isolation. By analyzing stock market volatility correlation, investors and analysts gain insight into systemic exposure, portfolio fragility, and the limits of traditional diversification under changing market conditions.
Risk Assessment and Concentration Risk
Market volatility correlation is fundamental to accurate risk assessment because it reveals concentration risk that is often hidden beneath surface-level diversification. Portfolios may contain many assets across sectors or regions, yet still be exposed to the same underlying risk factors such as interest rate movements, global capital flows, or shifts in investor sentiment. When assets exhibit high market volatility correlation, periods of stress cause volatility to rise simultaneously, leading to large aggregate losses.
This effect becomes especially pronounced during market downturns, when correlations tend to increase. By examining stock market volatility correlation, investors can identify whether volatility in the stock market is likely to affect multiple holdings at the same time. This allows for a more realistic assessment of downside risk and prevents overreliance on asset counts or sector labels as indicators of safety.
Portfolio Diversification
Portfolio diversification is effective only when assets exhibit sufficiently low or negative market volatility correlation. The goal of diversification is to reduce overall portfolio volatility by combining assets whose risk patterns do not move together. However, correlation is not static. Empirical evidence consistently shows that stock market volatility correlation increases during financial crises, reducing the benefits of diversification precisely when they are most needed.
Understanding this behavior enables investors to move beyond historical averages and consider how correlations behave across different market regimes. For students, this highlights why diversification strategies must account for volatility in the stock market rather than assuming stable relationships. Incorporating market volatility correlation into portfolio design improves resilience and reduces vulnerability to systemic shocks.
Hedging and Defensive Strategies
Market volatility correlation is central to the effectiveness of hedging and defensive investment strategies. Hedging relies on holding assets or instruments that respond differently to the same market conditions. Correlation analysis identifies whether such relationships are likely to persist during periods of heightened uncertainty. For traders, understanding what is volatility in trading includes recognizing that correlations often change when volatility rises.
A hedge that appears effective in stable markets may fail if market volatility correlation strengthens under stress. Evaluating correlation dynamics allows investors to assess whether defensive assets will continue to offset risk when volatility in the stock market increases. This makes correlation analysis essential for designing robust hedging strategies that perform under adverse market conditions.
Read Also: Disadvantages of Profitability Index in Assessing Investments
Measuring Market Volatility Correlation
Measuring market volatility correlation is a foundational task in financial analysis because it translates abstract risk relationships into quantifiable metrics that can be applied in portfolio construction, trading, and risk management. In modern financial markets, volatility in the stock market is not random but structured, often reflecting shared exposure to macroeconomic shocks, liquidity conditions, and investor behavior. Market volatility correlation captures whether these volatility patterns are transmitted across assets or remain isolated.
This section is critical because it explains how statistical tools are used to convert observed return data into meaningful indicators of co movement risk. Accurate measurement allows analysts to evaluate diversification, anticipate periods of heightened systemic risk, and understand why asset relationships observed in calm markets may break down under stress. While correlation coefficients provide an accessible starting point, advanced finance recognizes that market volatility correlation is dynamic rather than fixed. This section therefore moves from basic measurement using Pearson correlation to a deeper discussion of its limitations and the methods used to address them in applied financial analysis.
Pearson Correlation Coefficient
The Pearson correlation coefficient is the most widely used statistical tool for measuring market volatility correlation. It quantifies the degree of linear association between two asset return series and produces a value between minus one and plus one. A value close to plus one indicates that returns tend to move together, implying strong stock market volatility correlation and limited diversification benefits. A value near minus one indicates inverse movement, which is valuable for hedging. A value near zero suggests weak linear dependence.
Despite its simplicity, Pearson correlation plays a central role in portfolio theory, asset allocation, and risk modeling because it standardizes covariance and allows comparisons across assets with different volatility levels. However, its interpretation requires caution. Pearson correlation assumes stable relationships and focuses only on linear dependence. For students, understanding both its usefulness and its assumptions is essential to applying the market volatility correlation formula correctly in real market contexts.
Limitations of Static Correlation
Static correlation measures such as Pearson correlation are limited because they assume that relationships between assets remain constant over time. Empirical evidence shows that stock market volatility correlation is highly sensitive to market conditions. During periods of financial stress or heightened volatility in the stock market, correlations often increase sharply, even among assets that appeared weakly related during stable periods. This phenomenon leads to underestimation of risk when static correlation estimates are used in portfolio models.
Static correlation also fails to capture nonlinear dependence, asymmetry, and tail co movement, which are common during extreme market events. For students, this highlights a critical lesson in risk analysis. Correlation measured over long historical samples may provide a misleading sense of diversification and stability. Recognizing the limitations of static correlation encourages the use of more flexible approaches that better reflect how market volatility correlation behaves under changing economic and financial regimes.
Advanced Measurement Approaches
Advanced approaches to measuring market volatility correlation address the limitations of static models by allowing relationships to evolve over time. Rolling correlation analysis recalculates correlation over moving time windows, revealing how stock market volatility correlation changes across different market phases. Volatility based models incorporate time varying variance and covariance structures, improving sensitivity to shifts in market conditions. Scenario analysis and stress testing further extend correlation analysis by examining how asset relationships behave under extreme but plausible shocks.
These methods are particularly valuable for understanding volatility in the stock market during crises, when correlations tend to converge and diversification benefits weaken. For students, advanced measurement approaches demonstrate that correlation is not a fixed parameter but a dynamic characteristic of financial markets. Incorporating these methods leads to more realistic risk forecasts and a deeper understanding of how market volatility correlation influences portfolio performance and financial stability.
Practical Applications of Market Volatility Correlation
Practical applications of market volatility correlation demonstrate why the concept is central to both theoretical finance and real world decision making. Beyond its statistical definition, market volatility correlation informs how risk is combined, transferred, and amplified across assets, institutions, and entire financial systems. Volatility in the stock market rarely affects assets in isolation. Instead, shocks propagate through correlated channels shaped by investor behavior, leverage, and macroeconomic linkages.
Understanding these correlations allows practitioners to move from abstract risk metrics to actionable strategies in portfolio design, risk control, pricing, and policy analysis. For students, this section clarifies how correlation analysis is applied operationally rather than treated as a purely mathematical construct. Each application reflects a different scale of analysis, ranging from individual investment portfolios to systemic risk monitoring, while relying on the same underlying insight that market volatility correlation governs how uncertainty co moves across financial markets.
Portfolio Construction
In portfolio construction, market volatility correlation is a primary determinant of achievable diversification. Modern portfolio theory shows that portfolio risk depends not only on individual asset volatility but also on how asset returns co move. Assets with low or negative correlation reduce overall portfolio volatility by offsetting each other’s fluctuations. In practice, investors use correlation matrices to allocate capital across equities, bonds, commodities, and alternative assets in a way that smooths performance across market cycles. However, stock market volatility correlation is not constant.
During periods of market stress, correlations often rise, reducing diversification benefits precisely when they are most needed. Advanced portfolio construction therefore incorporates scenario analysis and stress testing to evaluate how correlations behave under adverse conditions. For students, this application illustrates why correlation analysis must be forward looking and regime aware rather than based solely on historical averages.
Risk Management
Risk management relies heavily on market volatility correlation to identify concentrations of exposure that are not visible at the individual asset level. Financial institutions monitor correlation patterns across portfolios, desks, and asset classes to detect shared sensitivity to common risk factors such as interest rates, liquidity shocks, or macroeconomic news. Rising stock market volatility correlation often signals increasing vulnerability to systemic events, as losses may occur simultaneously across positions that appear diversified.
Correlation analysis is therefore integral to value at risk models, stress testing frameworks, and capital allocation decisions. For students, this highlights how volatility in the stock market can translate into firm wide risk through correlated exposures. Effective risk management requires continuous monitoring of correlation dynamics and an understanding that abrupt changes in market volatility correlation can materially alter risk profiles.
Derivatives and Option Pricing
Market volatility correlation plays a critical role in the pricing and hedging of derivatives, particularly instruments that depend on multiple underlying assets. In basket options, spread options, and correlation swaps, expected correlation directly influences payoff distributions and valuation. Even for single asset options, correlation between volatility and market returns affects implied volatility surfaces and hedging effectiveness. Changes in correlation assumptions can significantly alter option prices and hedge ratios, leading to mispricing if ignored.
Traders who understand what is volatility in trading recognize that correlation risk is a distinct source of uncertainty, separate from price direction or volatility level. For students, this application shows how market volatility correlation enters derivative pricing models and why inaccurate correlation estimates can lead to substantial financial losses.
Macroeconomic and Systemic Analysis
At the macroeconomic level, stock market volatility correlation is used to assess financial interconnectedness and the potential for contagion during economic shocks. Policymakers and regulators analyze correlation patterns across markets and regions to identify channels through which volatility may spread. High and rising correlations often indicate reduced market resilience and increased systemic risk.
During crises, synchronized volatility across asset classes can amplify downturns and challenge financial stability. For students, this application connects market volatility correlation to broader economic outcomes, illustrating how micro level asset relationships aggregate into macro level risk. Understanding these dynamics is essential for analyzing financial crises and the effectiveness of regulatory interventions.
Read Also: Best Economics Essay Writing Services 2026
Calculating Market Volatility Correlation
Calculating market volatility correlation is a foundational task in financial economics because it translates abstract co movement concepts into measurable risk relationships. At an advanced level, this calculation links observed asset returns to underlying market structures, investor behavior, and shared exposure to macroeconomic shocks. Market volatility correlation allows analysts to evaluate how volatility in the stock market propagates across assets and whether diversification strategies are structurally sound or only conditionally effective. The calculation rests on two core statistical components, covariance and standard deviation, which together normalize joint movements into a scale free metric.
This normalization is essential because assets differ in price levels, volatility magnitude, and return distributions. For students, understanding how the market volatility correlation formula is constructed and interpreted provides insight into why correlation plays a central role in portfolio theory, risk management, and trading. The following discussion explains the mechanics of calculation and interpretation, using a numerical example to show how statistical inputs translate into economically meaningful conclusions.
Statistical Foundation of the Calculation
Market volatility correlation is derived from the relationship between covariance and individual asset volatility. Covariance measures whether two return series tend to move together, but its magnitude depends on the scale of the variables involved. By dividing covariance by the product of the standard deviations of each asset, the correlation coefficient standardizes this relationship. This step transforms covariance into a dimensionless measure bounded between minus one and plus one.
In the context of volatility in the stock market, this standardization allows analysts to compare relationships across asset classes, time periods, and market regimes. For example, equity equity correlations can be meaningfully compared with equity bond correlations despite differences in return volatility. At a doctoral level, this foundation highlights why correlation is not merely descriptive but structural. It embeds assumptions about linear dependence and stationarity that must be critically evaluated when applying the market volatility correlation formula in empirical research.
The Pearson Correlation Formula Explained
The Pearson correlation coefficient is the most widely used market volatility correlation formula in financial analysis. It measures the strength and direction of the linear relationship between the returns of two assets and standardizes this relationship so it can be compared across markets and time periods.
Correlation (X, Y) = Covariance (X, Y) / [Standard Deviation of X × Standard Deviation of Y]
This formula produces a value between −1 and +1, where positive values indicate co movement, negative values indicate inverse movement, and values near zero indicate weak linear association.
Supporting Formulas
To compute the Pearson correlation, each component must first be calculated.
Mean Return
Mean of X = (Sum of returns of X) / n
Mean of Y = (Sum of returns of Y) / n
Covariance Formula
Covariance (X, Y) = [ Σ (Xi − Mean X)(Yi − Mean Y) ] / (n − 1)
Covariance measures whether returns on assets X and Y tend to move together. A positive value indicates joint upward or downward movement, while a negative value indicates opposite movement.
Standard Deviation Formula
Standard Deviation of X = √[ Σ (Xi − Mean X)² / (n − 1) ]
Standard Deviation of Y = √[ Σ (Yi − Mean Y)² / (n − 1) ]
Standard deviation measures volatility in the stock market for each asset individually.
Numerical Working Example
Assume two assets with weekly returns over five periods.
Mean return of Asset X = 0.006
Mean return of Asset Y = 0.002
Step 1: Compute deviations from the mean for each period.
Step 2: Multiply paired deviations to obtain joint deviations.
Step 3: Sum the joint deviations and divide by (n − 1) to obtain covariance.
Assume Covariance (X, Y) = 0.00029
Step 4: Compute the standard deviation of each asset.
Assume Standard Deviation of X = 0.019
Assume Standard Deviation of Y = 0.015
Step 5: Apply the Pearson correlation formula.
Correlation (X, Y) = 0.00029 / (0.019 × 0.015)
Correlation (X, Y) ≈ 0.51
Interpretation
A correlation value of approximately 0.51 indicates a moderate positive market volatility correlation between the two stocks. This implies that volatility shocks affecting Stock A are likely to be partially reflected in Stock B, though not perfectly. From a portfolio perspective, diversification benefits exist but are limited. During periods of elevated volatility in the stock market, correlations of this magnitude often increase, further reducing diversification effectiveness.
For risk management, this result suggests exposure to shared risk factors such as macroeconomic conditions or sector specific dynamics. For students, the interpretation reinforces that correlation is not static and must be evaluated in the context of market regimes. Market volatility correlation therefore serves not only as a descriptive statistic but as a critical input into forward looking risk assessment and portfolio design.
The Market Volatility Correlation Formula
The most widely used method for measuring market volatility correlation is the Pearson correlation coefficient. This formula quantifies the strength and direction of the linear relationship between the returns of two financial assets.
Pearson Correlation Formula
Correlation (X, Y) = Covariance (X, Y) / [Standard Deviation of X × Standard Deviation of Y]
Where:
-
Correlation (X, Y) represents the market volatility correlation between assets X and Y
-
Covariance (X, Y) measures how the returns of the two assets move together
-
Standard Deviation of X is the volatility of returns for asset X
-
Standard Deviation of Y is the volatility of returns for asset Y
The result of this calculation is a value between −1 and +1.
A value close to +1 indicates strong positive correlation, meaning the assets tend to move together.
A value close to −1 indicates strong negative correlation, meaning the assets tend to move in opposite directions.
A value near 0 suggests little or no linear relationship between the assets.
This formula forms the statistical foundation for analyzing market volatility correlation in portfolio management, risk assessment, and trading decisions.
Step-by-Step Numerical Example
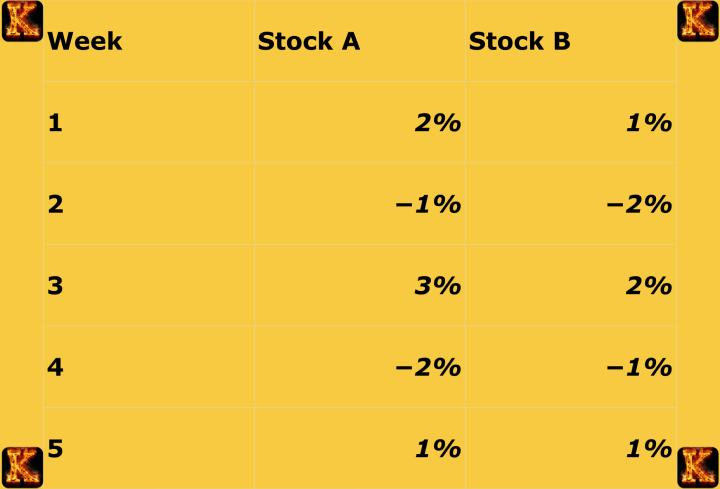
Assume two stocks, A and B, with weekly returns over five periods:
Conclusion
Market volatility correlation is a fundamental concept in modern finance because it explains how risk is transmitted across assets, markets, and financial systems. By examining how asset returns and volatility move together, correlation analysis reveals why apparent diversification may fail during periods of heightened market stress and why portfolios that perform well in stable conditions can become highly vulnerable during crises. Understanding market volatility correlation therefore allows investors and analysts to move beyond surface level asset allocation and focus on underlying sources of shared risk.
For students of finance, market volatility correlation provides the analytical foundation for portfolio construction, risk assessment, and volatility management. It clarifies the limits of traditional diversification, highlights the importance of dynamic correlation behavior, and strengthens the interpretation of empirical results in financial research. For practitioners, correlation analysis supports more robust hedging strategies, improves stress testing, and enhances decision making under uncertainty.
In an increasingly interconnected financial environment, mastering market volatility correlation is essential for informed investment analysis and effective risk management. Students seeking additional academic support or applied perspectives may consult platforms such as kessays.com, kector.com, myassignmenthelp.com, and peachyessay.com for further guidance on finance and investment analysis.