Introduction
Non-Financial Factors in NPV Calculations matter for investment appraisal. This article explains how to include market demand, technology risk, regulatory shifts, environmental cost, social value, and stakeholder acceptance in cash flow models. Students should learn how Non-Financial Factors in NPV Calculations affect expected cash flows, discount rate selection, and project ranking.
Understanding NPV Calculations and Non-Financial Factors in NPV Calculations
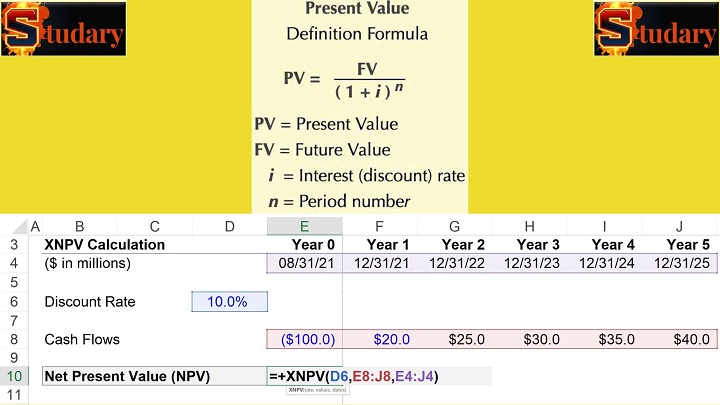
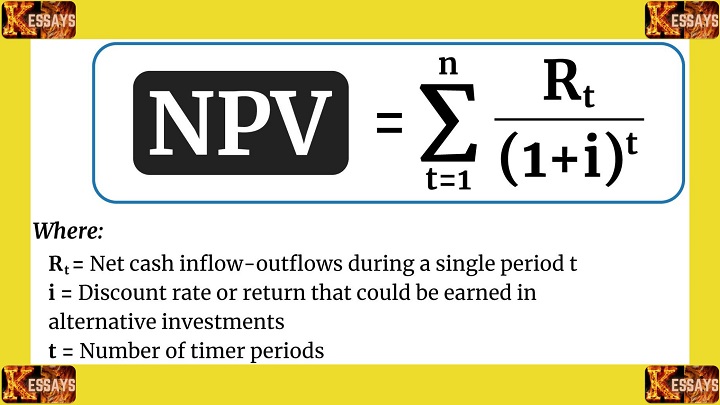
NPV equals present value of projected cash inflows minus present value of cash outflows. Choose a discount rate which reflects time preference and project risk. Forecast cash flows using revenue models, operating costs, capital expense, and working capital needs. Non-Financial Factors in NPV Calculations shape revenue paths, cost profiles, and project life. Apply sensitivity analysis and scenario planning to show how non-financial inputs change NPV outcomes. Non-Financial Factors in NPV Calculations require you to translate qualitative signals into quantitative assumptions before final valuation.

Market Demand and Trends: Quantifying consumer signals for NPV
Estimate market size and adoption curves. Use primary research, sales pilots, and competitor data to build revenue trajectories. When you create scenarios, assign probabilities and adjust cash flows accordingly.
-
Conservative case, low adoption, lower revenue. Use Non-Financial Factors in NPV Calculations to justify conservative forecasts.
-
Base case, expected adoption, stable share. Use Non-Financial Factors in NPV Calculations to set probability weights.
-
Upside case, rapid adoption, higher revenue. Use Non-Financial Factors in NPV Calculations for stress testing and contingency design.
Technological Advancements: Modeling obsolescence, adoption, and option value
Assess upgrade cost and potential productivity gain when technology enters the model. Non-Financial Factors in NPV Calculations include probability of rapid obsolescence and supplier concentration risk. Value learning curves, modular design, and platform lock in when you set capital budgets. Non-Financial Factors in NPV Calculations require option value analysis for delaying or staging investment. Run Monte Carlo simulation on tech progress assumptions and feed distribution into NPV. Non-Financial Factors in NPV Calculations also include ecosystem shifts from platform change or regulatory tech policy.
Environmental and Social Impact: Shadow pricing carbon, social license, and regulatory cost
Price carbon, waste management, water use, and remediation in economic terms. Non-Financial Factors in NPV Calculations include compliance cost and loss of social license when communities oppose a project. Use internal carbon price and permit cost estimates to adjust operating expense. Non-Financial Factors in NPV Calculations affect probability of fines, permit delays, and reputational loss which reduce projected cash flows. Apply social return on investment measures and include quantified benefits from local hiring and training. Non-Financial Factors in NPV Calculations should enter scenario weights and contingency reserves.
Incorporating Non-Financial Factors in NPV Calculations: Methods and tools
Use three practical methods to include non-financial inputs in valuation.
-
Monetary translation of non-financial inputs into annual cash flow adjustments. Non-Financial Factors in NPV Calculations enter the cash flow series via shadow prices or adjusted revenues.
-
Probability weighting through scenario analysis and stochastic simulation. Use Non-Financial Factors in NPV Calculations to set scenario probabilities from stakeholder risk assessments.
-
Multi-criteria decision analysis and strategic scoring with a conversion to monetary equivalents for final ranking. Use Non-Financial Factors in NPV Calculations when you include real options value for flexibility. Provide transparent documentation for each non-financial assumption, show data sources, expert elicitation, and sensitivity ranges. Example. Base forecast yields annual operating cash flow of 1,000,000 for five years. Add a shadow carbon cost of 50,000 per year. Recompute NPV using discount rate of 10 percent. The adjusted NPV falls by present value of the added cost. Present value of the added cost equals 50,000 times annuity factor.
Balancing Financial and Non-Financial Factors: Decision frameworks for project selection
Adopt a weighted scorecard where financial NPV sits alongside non-financial scores. Assign weights through governance and align weights with corporate strategy. Non-Financial Factors in NPV Calculations must receive clear scoring rules and audit trails. Run sensitivity analysis showing how shifts in non-financial scores alter project ranking by NPV. Non-Financial Factors in NPV Calculations should influence hurdle rates, contingency budgets, and investment gates. Use portfolio level analysis to choose a mix of projects balancing cash returns and strategic impact. Non-Financial Factors in NPV Calculations require stakeholder sign off and post implementation monitoring.
Read Also: Nurses’ Role in Healthcare Capital Budgeting
II. Non-Financial Factors in Investment Evaluations
Market Demand and Trends
Market demand and industry trends are among the most important non-financial factors in NPV calculations. Financial numbers depend heavily on how much demand exists for a product or service. If customer preferences shift, or if a market becomes saturated, even the most promising project can turn unprofitable.
Unlike financial figures, market demand and trends are not always captured in accounting reports. They require market research, surveys, competitor analysis, and scenario planning. One practical way to integrate them into NPV is by using different demand scenarios.
Example: New Mobile Application Investment
-
Initial investment cost: $500,000
-
Discount rate: 10%
-
Scenarios based on demand research:
-
Scenario 1: Conservative Demand
Annual cash inflows = $100,000 for 3 years, then decline by 10% per year.-
Year 1: 100,000 ÷ (1.10)^1 = 90,909.09
-
Year 2: 100,000 ÷ (1.10)^2 = 82,644.63
-
Year 3: 100,000 ÷ (1.10)^3 = 75,131.48
-
Year 4: 90,000 ÷ (1.10)^4 = 61,465.53
-
Year 5: 81,000 ÷ (1.10)^5 = 50,300.90
Total PV of inflows = 360,451.63
NPV = –500,000 + 360,451.63 = –139,548.37Interpretation: The project destroys value under conservative demand.
-
-
Scenario 2: Moderate Demand
Annual cash inflows = $150,000 for 3 years, then decline by 5% per year.-
Year 1: 150,000 ÷ (1.10)^1 = 136,363.64
-
Year 2: 150,000 ÷ (1.10)^2 = 123,966.94
-
Year 3: 150,000 ÷ (1.10)^3 = 112,697.72
-
Year 4: 142,500 ÷ (1.10)^4 = 97,663.41
-
Year 5: 135,375 ÷ (1.10)^5 = 84,722.69
Total PV of inflows = 555,414.40
NPV = –500,000 + 555,414.40 = +54,414.40Interpretation: The project adds value, but the margin is modest.
-
-
Scenario 3: High Demand
Annual cash inflows = $200,000 for 3 years, then decline by 3% per year.-
Year 1: 200,000 ÷ (1.10)^1 = 181,818.18
-
Year 2: 200,000 ÷ (1.10)^2 = 165,289.26
-
Year 3: 200,000 ÷ (1.10)^3 = 150,262.26
-
Year 4: 194,000 ÷ (1.10)^4 = 132,970.27
-
Year 5: 188,180 ÷ (1.10)^5 = 118,399.15
Total PV of inflows = 748,739.12
NPV = –500,000 + 748,739.12 = +248,739.12Interpretation: The project generates significant value if demand is strong.
-
Key Lesson: By considering market demand and trends, managers understand both the risks and opportunities of the project. A single-point NPV could mislead, but scenario-based NPV makes the analysis more realistic.
Technological Advancements
Technology evolves rapidly, and ignoring it in investment planning can lead to losses. Non-financial factors like automation, artificial intelligence, and digitization affect costs, productivity, and market competitiveness.
-
Positive effects of technological adoption:
-
Higher efficiency through automation
-
Lower operating costs in the long run
-
Improved product quality and consistency
-
Stronger competitive positioning
-
-
Risks of ignoring technological shifts:
-
Faster obsolescence of assets
-
Higher maintenance costs
-
Reduced market relevance
-
Example: A company evaluating a manufacturing plant must decide whether to use traditional machinery or invest in robotics and AI-driven systems.
-
Traditional machinery may reduce upfront cost, but long-term competitiveness will weaken.
-
Advanced automation raises the initial investment, but lowers production costs, improves scalability, and increases resilience against labor shortages.
Incorporating these into NPV requires adjusting projected inflows and outflows based on technology adoption or obsolescence.
Environmental and Social Impact
Environmental and social factors influence investment decisions more than ever before. Customers, regulators, and investors demand responsible practices. A project that ignores sustainability risks reputational damage, regulatory fines, and customer boycotts.
-
Environmental factors to consider:
-
Carbon emissions
-
Resource consumption (water, energy, raw materials)
-
Waste generation and recycling
-
-
Social factors to consider:
-
Community impact
-
Employee welfare and diversity policies
-
Ethical sourcing and supply chain responsibility
-
Example: A construction company considering a housing project must evaluate sustainability.
-
If it builds with environmentally harmful materials, the project may face resistance and legal penalties.
-
If it invests in green design, it may qualify for tax incentives, enjoy better sales, and gain reputational value.
By reflecting these in cash inflows (e.g., higher sales due to eco-conscious buyers) or outflows (e.g., penalties avoided), organizations integrate environmental and social impact into NPV.
Read Also: How to Calculate NPV for Personal Investment Decisions
III. Incorporating Non-Financial Factors in NPV Calculations
Traditional NPV calculations focus only on financial inflows and outflows, but investment decisions are rarely made on numbers alone. Non-financial factors such as risk, culture, reputation, and community impact must also be incorporated. Since these cannot always be expressed directly in dollars, organizations use qualitative analysis, scenario analysis, and stakeholder engagement to ensure a balanced evaluation.1. Qualitative Analysis
What it is:
Qualitative analysis looks at the “soft” or non-financial aspects of an investment. Instead of only focusing on dollar figures, it considers subjective elements such as strategic alignment, cultural fit, brand reputation, and stakeholder trust. These factors cannot be plugged into formulas directly, but they often determine whether a financially promising investment will actually succeed in practice.How it works:
- Identify key non-financial factors (culture, leadership, reputation, relationships).
- Evaluate them using structured tools (surveys, expert interviews, market studies).
- Assign ratings or qualitative descriptions (e.g., 1–5 scale from “poor” to “excellent”).
- Combine the findings with financial NPV results to form a holistic picture.
Example: A Merger Evaluation
A company is considering merging with another firm. The financial analysis shows that the merger would create $50 million in synergies. However, management conducts a qualitative analysis to ensure hidden risks are addressed.- Organizational Culture: Surveys reveal that one company has a rigid, hierarchical culture while the other values flat structures and employee autonomy. Compatibility score = 2/5 (low).
- Leadership Compatibility: Interviews show both CEOs have collaborative leadership styles. Score = 4/5 (high).
- Brand Reputation: Market research indicates both firms have strong customer trust. Score = 5/5 (very strong).
- Stakeholder Relationships: Supplier interviews reveal mixed opinions about the merger’s impact. Score = 3/5 (medium).
Interpretation:
While the NPV calculation looks attractive, the weak cultural alignment signals possible integration challenges. Decision-makers must weigh whether the cultural risk outweighs the financial gain or whether mitigation strategies (like cultural integration programs) can close the gap.
2. Scenario Analysis
What it is: Scenario analysis explores how financial results (like NPV) change under different non-financial conditions. Instead of relying on a single forecast, it builds multiple “what if” stories: best case, moderate case, and worst case. This shows how robust the investment is when external factors such as regulations, community acceptance, or technology adoption change. How it works:- Identify key uncertainties (e.g., policy changes, public opinion, weather patterns).
- Create realistic scenarios (favorable, moderate, challenging).
- Estimate cash inflows for each scenario.
- Calculate NPV for each scenario using the discount rate.
- Compare results to assess resilience.
- Initial investment: $10,000,000
- Discount rate: 8%
Scenario 1: Favorable Conditions
(Strong public support, minimal regulatory hurdles, optimal wind)
Cash inflows = $1,000,000 for 4 years, then $950,000 in year 5.
NPV = –10,000,000 + (1,000,000 / 1.08^1) + (1,000,000 / 1.08^2) + (1,000,000 / 1.08^3) + (1,000,000 / 1.08^4) + (950,000 / 1.08^5)
= –10,000,000 + (925,925.93 + 857,338.35 + 793,828.10 + 735,026.02 + 646,644.66)
= –10,000,000 + 3,958,763.06
= –$6,041,237
Scenario 2: Moderate Conditions
(Moderate regulation, average public support, average wind)
Cash inflows = $800,000 for 4 years, then $736,000 in year 5.
NPV = –10,000,000 + (800,000 / 1.08^1) + (800,000 / 1.08^2) + (800,000 / 1.08^3) + (800,000 / 1.08^4) + (736,000 / 1.08^5)
= –10,000,000 + (740,740.74 + 685,870.68 + 635,062.49 + 588,020.82 + 500,270.54)
= –10,000,000 + 3,149,965.27
= –$6,850,035
Scenario 3: Challenging Conditions
(Strict regulation, weak public support, poor wind conditions)
Cash inflows = $500,000 for 4 years, then $460,000 in year 5.
NPV = –10,000,000 + (500,000 / 1.08^1) + (500,000 / 1.08^2) + (500,000 / 1.08^3) + (500,000 / 1.08^4) + (460,000 / 1.08^5)
= –10,000,000 + (462,962.96 + 428,669.34 + 396,914.05 + 367,513.01 + 312,716.85)
= –10,000,000 + 1,968,776.21
= –$8,031,224
Interpretation:
- In all scenarios, the project’s NPV is negative (unprofitable).
- Scenario 1 has the smallest loss, but still unattractive.
- This analysis shows that unless subsidies or higher energy prices are factored in, the wind farm may not be financially viable.
3. Stakeholder Engagement
What it is:
Stakeholder engagement means actively involving people who are affected by or have influence over the investment. These include employees, customers, local communities, suppliers, regulators, and advocacy groups. Their perspectives help identify non-financial risks and opportunities that raw financial analysis might miss. How it works:- Identify key stakeholders for the project.
- Use surveys, focus groups, interviews, or community meetings to collect feedback.
- Incorporate findings into demand forecasts, cost assumptions, or risk analysis.
- Combine results with NPV to ensure both financial and social feasibility.
- Conduct focus groups with potential customers to test product design, comfort, and features.
- Meet with health regulators to ensure compliance with safety standards.
- Consult suppliers to confirm supply chain stability and fair labor practices.
- Customers rate the product highly for usability but raise concerns about data privacy.
- Regulators confirm compliance but warn of stricter privacy laws coming.
- Suppliers show confidence in scaling production.
IV. Balancing Financial and Non-Financial Factors
Balancing financial and non-financial factors represents one of the most complex challenges in modern investment decision-making. While financial metrics such as Net Present Value (NPV), Internal Rate of Return (IRR), and Return on Investment (ROI) are indispensable in quantifying the economic feasibility of projects, they are inherently limited in scope. Financial models typically assume rational actors, stable markets, and quantifiable risks. However, real-world investments are embedded in dynamic socio-economic, political, and ecological systems. Consequently, decisions that rely exclusively on financial indicators risk underestimating long-term risks and overvaluing short-term gains.
Incorporating non-financial considerations, such as environmental sustainability, social responsibility, regulatory compliance, stakeholder legitimacy, and strategic alignment, broadens the evaluative lens. This integrative approach reflects the principles of stakeholder theory, triple bottom line accounting (TBL), and ESG (environmental, social, and governance) frameworks, which argue that firm value cannot be disentangled from the wider ecosystems in which organizations operate. Thus, balancing financial and non-financial factors does not dilute decision-making; rather, it strengthens resilience, mitigates reputational risks, and aligns corporate strategies with sustainable value creation.
Case Illustration
A company is considering an investment to expand its manufacturing capabilities.
-
Initial investment: $2,000,000
-
Expected cash inflows: $500,000 annually for five years
-
Discount rate: 10%
Financial Analysis (NPV):
NPV = –2,000,000 + (500,000 / 1.10^1) + (500,000 / 1.10^2) + (500,000 / 1.10^3) + (500,000 / 1.10^4) + (500,000 / 1.10^5)
If this calculation yields a positive NPV, the project is deemed financially viable under traditional capital budgeting assumptions.
Non-Financial Considerations
-
Environmental Impact
-
The expansion may increase energy demand and emissions. However, if the project incorporates renewable energy or resource efficiency measures, it may improve the firm’s environmental performance.
-
Quantitative sustainability indicators, such as reduction in CO₂ emissions per unit of output, can be integrated into decision matrices to assess long-term ecological feasibility.
-
-
Social Responsibility
-
Beyond job creation, the project may influence local communities through workforce diversity, skill development, and economic empowerment.
-
Social Return on Investment (SROI) methodologies can be used to estimate the monetary value of these social impacts, thereby complementing NPV with a socio-economic dimension.
-
-
Strategic Fit
-
From a corporate strategy perspective, the project must align with the firm’s long-term objectives, whether achieving market leadership, entering new geographies, or consolidating supply chains.
-
Strategic alignment can be evaluated through portfolio analysis tools (e.g., BCG Matrix, Ansoff’s Growth Matrix) or real options theory, which values managerial flexibility under uncertainty.
-
Integrative Evaluation Approach
To operationalize the balance, firms can use multi-criteria decision-making (MCDM) methods such as:
-
Weighted Scoring Models: Assigning relative importance (e.g., 70% financial, 30% non-financial) and scoring factors such as NPV, environmental compliance, and strategic synergy.
-
Analytic Hierarchy Process (AHP): Structuring decision criteria into a hierarchy and applying pairwise comparisons to derive objective weightings.
-
Balanced Scorecard (BSC): Linking financial outcomes with customer perspectives, internal processes, and learning/innovation dimensions.
In practice, a company might score the investment as follows:
| Factor | Weight | Score (1–10) | Weighted Score |
|---|---|---|---|
| Financial NPV/ROI | 0.70 | 9 | 6.3 |
| Environmental Impact | 0.10 | 8 | 0.8 |
| Social Responsibility | 0.10 | 7 | 0.7 |
| Strategic Fit | 0.10 | 9 | 0.9 |
| Total | 1.0 | 8.7/10 |
This structured weighting ensures that financial performance remains central, while non-financial dimensions act as decisive differentiators, especially when comparing projects with similar NPVs.
Comments are closed!