
In the world of finance, capital budgeting is a critical process that helps organizations make informed investment decisions. Among the various tools used in capital budgeting, the profitability index plays a significant role. In this comprehensive article, we will look into the role of profitability index in capital budgeting, providing expert insights and examples to enhance understanding and proficiency.

I. Understanding Capital Budgeting
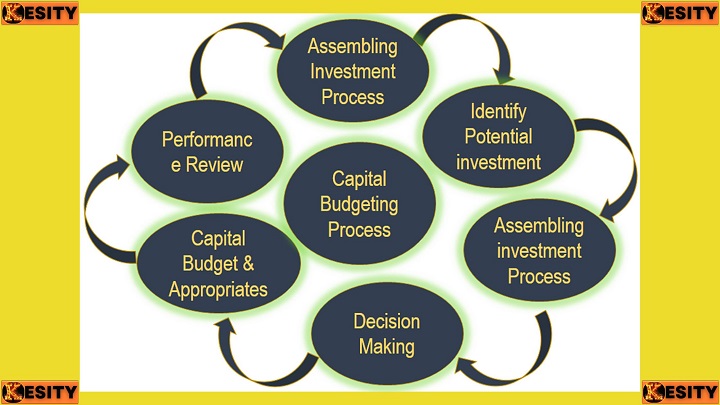
Capital budgeting refers to the process of evaluating and selecting long-term investment projects that yield returns over an extended period. This process involves assessing the potential profitability and financial feasibility of investment opportunities. In capital budgeting, decision-makers analyze cash flows, consider risk factors, estimate future returns, and evaluate the time value of money. By incorporating financial analysis techniques and tools, organizations aim to maximize returns on investment while minimizing risks.II. The Profitability Index: An Essential Tool in Capital Budgeting
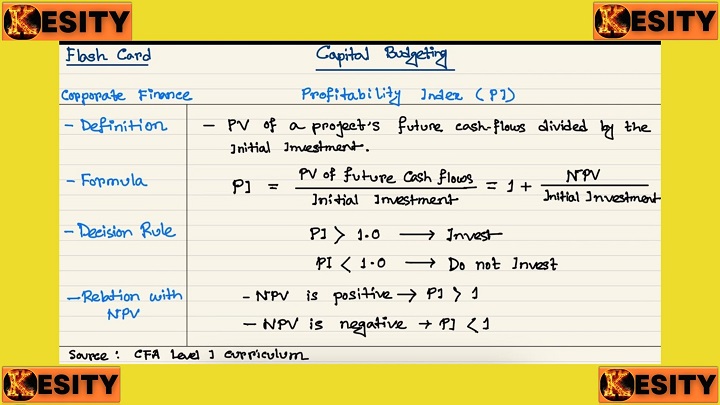
The profitability index, also known as the profit investment ratio (PIR) or the benefit-cost ratio (BCR), is a crucial tool used in capital budgeting to assess the profitability and financial viability of investment projects. The profitability index is calculated by dividing the present value of cash inflows by the present value of cash outflows associated with the investment project. The formula for calculating profitability index is as follows: Profitability Index = Present Value of Cash Inflows / Present Value of Cash Outflows The profitability index provides decision-makers with a quantitative measure to evaluate the value and attractiveness of investment projects. It helps assess the project's potential to generate positive net cash flows and deliver a return on investment.
III. The Role of Profitability Index in Capital Budgeting
-
Evaluating Investment Projects
Example 1
Suppose a company is considering two investment projects. Project A has a profitability index of 1.2, while Project B has a profitability index of 1.5. The decision-makers can conclude that Project B is more financially attractive, as it offers a higher return for each unit of investment.-
Ranking Investment Proposals
Example 2
A company has three investment proposals - Project X with a profitability index of 1.8, Project Y with a profitability index of 1.5, and Project Z with a profitability index of 1.2. The decision-makers can rank the proposals in descending order based on their profitability index, prioritizing Project X, followed by Project Y and Project Z.-
Considering Time Value of Money
Example 3
A company is considering an investment project that requires an initial investment of $500,000. The project is expected to generate cash inflows of $100,000 per year for five years. By discounting the cash inflows and outflows using an appropriate discount rate, the profitability index accounts for the time value of money, providing a more accurate measure of the project's profitability.-
Assessing Project Viability
Example 4
An organization establishes a minimum profitability index of 1.2. If a potential investment project has a profitability index below 1.2, it is considered less financially viable and may be rejected. Projects with profitability indices above 1.2 are considered more attractive and have a higher likelihood of being approved.
IV. Limitations of Profitability Index
While the profitability index is a valuable tool in capital budgeting, it is important to acknowledge its limitations. Some limitations include:-
Inability to Consider Project Size Differences:
-
Ignoring Non-monetary Factors:
Read Also: Cash in Financial Accounting: The Lifeblood of Business
Example 1
An organization is evaluating two investment projects: Project A and Project B. Project A requires an initial investment of $100,000 and is expected to generate cash inflows of $30,000 per year for five years. Project B requires an initial investment of $150,000 and is expected to generate cash inflows of $45,000 per year for five years. The discount rate used for calculating the present value is 10%.To calculate the profitability index for each project:
Project A
Present Value of Cash Inflows = $30,000 / (1+0.10)^1 + $30,000 / (1+0.10)^2 + $30,000 / (1+0.10)^3 + $30,000 / (1+0.10)^4 + $30,000 / (1+0.10)^5 = $110,493.83 Present Value of Cash Outflows = $100,000 Profitability Index for Project A = $110,493.83 / $100,000 = 1.10Project B
Present Value of Cash Inflows = $45,000 / (1+0.10)^1 + $45,000 / (1+0.10)^2 + $45,000 / (1+0.10)^3 + $45,000 / (1+0.10)^4 + $45,000 / (1+0.10)^5 = $165,740.74 Present Value of Cash Outflows = $150,000 Profitability Index for Project B = $165,740.74 / $150,000 = 1.11 In this example, both projects have profitability indices above 1. This indicates that both projects are expected to generate more value than the initial investment. However, Project B has a higher profitability index, suggesting it offers a better return on investment compared to Project A.Example 2
A company is considering three investment projects: Project X, Project Y, and Project Z. The initial investments and expected cash flows for each project are as follows:Project X
Initial Investment = $500,000, Cash Inflows = $100,000 per year for five years Project Y: Initial Investment = $400,000, Cash Inflows = $80,000 per year for six years Project Z: Initial Investment = $300,000, Cash Inflows = $70,000 per year for seven yearsAssuming a discount rate of 8%, we can calculate the profitability index for each project:
Project X
Present Value of Cash Inflows = $100,000 / (1+0.08)^1 + $100,000 / (1+0.08)^2 + $100,000 / (1+0.08)^3 + $100,000 / (1+0.08)^4 + $100,000 / (1+0.08)^5 = $387,420.49 Present Value of Cash Outflows = $500,000 Profitability Index for Project X = $387,420.49 / $500,000 = 0.77Project Y
Present Value of Cash Inflows = $80,000 / (1+0.08)^1 + $80,000 / (1+0.08)^2 + $80,000 / (1+0.08)^3 + $80,000 / (1+0.08)^4 + $80,000 / (1+0.08)^5 + $80,000 / (1+0.08)^6 = $386,359.46 Present Value of Cash Outflows = $400,000 Profitability Index for Project Y = $386,359.46 / $400,000 = 0.97Project Z
Present Value of Cash Inflows = $70,000 / (1+0.08)^1 + $70,000 / (1+0.08)^2 + $70,000 / (1+0.08)^3 + $70,000 / (1+0.08)^4 + $70,000 / (1+0.08)^5 + $70,000 / (1+0.08)^6 + $70,000 / (1+0.08)^7 = $440,144.25 Present Value of Cash Outflows = $300,000 Profitability Index for Project Z = $440,144.25 / $300,000 = 1.47 In this example, Project Z has the highest profitability index of 1.47, indicating it has the highest potential return on investment among the three projects. The profitability index helps in ranking the projects and provides valuable insights for decision-making in capital budgeting.
Comments are closed!