")
Introduction
In finance and investment analysis, Net Present Value (NPV) and Internal Rate of Return (IRR) are core capital budgeting techniques used to assess the profitability, viability, and financial attractiveness of investment projects. These methods are widely applied by firms, investors, and policymakers when making long-term investment decisions. For students studying finance, economics, accounting, or MBA programs, NPV and IRR are central topics in assignments and examinations, yet they often cause difficulty due to their technical calculations, underlying assumptions, and the possibility of conflicting results.
This article is designed to provide clear and structured NPV and IRR assignment help by explaining the meaning of NPV and IRR, outlining their formulas and calculation methods, and demonstrating how they are applied in practical investment decision making. It also addresses common academic challenges, including NPV versus IRR conflicts, differences in project rankings, and the selection of mutually exclusive projects using appropriate decision criteria.
By the end of this article, students should be able to:
-
Understand what NPV and IRR measure and why they are important
-
Identify situations where NPV and IRR give conflicting signals
-
Apply correct decision rules in assignments and exams
-
Interpret results using real-world logic rather than formulas alone

1. Understanding NPV and IRR: Core Concepts
Net Present Value (NPV)
Net Present Value, commonly abbreviated as NPV, is a capital budgeting technique that measures the total value an investment is expected to generate after accounting for the time value of money. It is calculated by discounting all future cash inflows and outflows to their present value using a specified discount rate, usually the cost of capital, and then subtracting the initial investment. NPV shows whether a project creates or destroys value in today’s terms.
Decision Rule
If the NPV of a project is greater than zero, the project should be accepted because it is expected to add value to the firm or investor. If the NPV is less than zero, the project should be rejected because it is expected to reduce overall value.
Key Strength of NPV
The primary strength of NPV is that it directly measures value creation. It aligns closely with the objective of maximizing shareholder wealth by showing the absolute amount of value a project contributes. For this reason, NPV is widely regarded as the most reliable method for evaluating investment projects, especially when comparing mutually exclusive alternatives.
Internal Rate of Return (IRR)
Internal Rate of Return, or IRR, is the discount rate at which a project’s Net Present Value equals zero. In other words, it represents the expected rate of return generated by the project over its lifetime. IRR focuses on the efficiency of the investment rather than the absolute value it creates.
Decision Rule
A project should be accepted if its IRR is greater than the required rate of return or cost of capital, as this indicates the project is expected to earn more than the minimum acceptable return. If the IRR is lower than the cost of capital, the project should be rejected because it fails to meet the required performance threshold.
Key Strength of IRR
The main strength of IRR lies in its simplicity and intuitive appeal. Because it is expressed as a percentage, it is easy to compare with interest rates, required returns, or alternative investment opportunities. This makes IRR particularly useful for communicating investment performance, although it should be used carefully alongside NPV for sound financial decision making.
Read Also: Behavioral Biases in Capital Budgeting
2. Why NPV and IRR Conflict in Mutually Exclusive Projects
Conflicts between Net Present Value (NPV) and Internal Rate of Return (IRR) commonly arise when evaluating mutually exclusive projects, meaning that only one project can be accepted and choosing one automatically eliminates the others. Although both NPV and IRR are used to assess project profitability, they rely on different assumptions and evaluation perspectives. As a result, they can recommend different projects, even when analyzing the same set of cash flows.
Key Reasons for Conflict
1. Timing of Cash Flows
The timing of cash flows plays a major role in creating conflicts between NPV and IRR. Projects that generate cash inflows earlier in their life tend to produce higher IRRs because returns are received sooner and reinvested earlier. In contrast, projects that generate larger cash flows later in the project’s life may have lower IRRs but higher NPVs because the total value of discounted cash inflows is greater over time.
Why This Causes Conflict
IRR places more emphasis on how quickly returns are generated, while NPV focuses on the total value created regardless of when the cash flows occur. As a result, a project with faster early returns may rank higher under IRR, while a project with larger long term cash flows may rank higher under NPV.
2. Reinvestment Assumptions
Another major source of conflict is the assumption each method makes about reinvestment of intermediate cash flows. NPV assumes that all cash inflows are reinvested at the firm’s cost of capital, which reflects realistic market opportunities. IRR, on the other hand, assumes that cash flows are reinvested at the project’s own IRR, which can be very high and often unrealistic.
Why This Causes Conflict
When a project has a high IRR, the assumption that interim cash flows can be reinvested at that same high rate may overstate the project’s attractiveness. This can cause IRR to favor projects that appear efficient but may not generate the most realistic or sustainable value when compared using NPV.
3. Scale of Investment
Differences in project size or scale also contribute to conflicts between NPV and IRR. Smaller projects often require lower initial investments and can produce high percentage returns, resulting in high IRRs. Larger projects may require substantial initial capital but generate much higher total cash inflows, leading to higher NPVs even if their IRRs are lower.
Why This Causes Conflict
IRR measures returns in percentage terms, while NPV measures value in absolute monetary terms. This means IRR may favor smaller projects with impressive percentage returns, whereas NPV favors projects that add more total value to the firm or investor.
How to Resolve NPV vs. IRR Conflicts
Prioritize NPV for Mutually Exclusive Projects
When projects are mutually exclusive, NPV should be given priority because it directly measures how much value a project adds. The goal of most firms and investors is to maximize total wealth, not percentage returns. NPV aligns with this objective by identifying the project that creates the greatest increase in value.
Conduct Sensitivity Analysis
Sensitivity analysis involves changing key variables such as the discount rate, cash flow estimates, or project duration to observe how NPV and IRR respond. This helps students and analysts understand how robust a project’s evaluation is under different assumptions and highlights which project performs better across a range of realistic scenarios.
Consider Risk, Scale, and Strategic Fit
Investment decisions should not rely solely on numerical results. Risk levels, project size, uncertainty of cash flows, and alignment with long term strategic goals are all critical considerations. A project with a slightly lower IRR but a higher NPV and lower risk may be the more appropriate choice in both academic analysis and real world decision making.

3. Differences in Project Rankings Using NPV and IRR
It is common for Net Present Value (NPV) and Internal Rate of Return (IRR) to rank investment projects differently, even when both methods are applied correctly. This situation often confuses students, especially in exams and assignments. Understanding the reasons behind these ranking differences is essential for providing strong academic explanations and for demonstrating a clear grasp of capital budgeting concepts.
Causes of Ranking Differences
Different Cash Flow Patterns
Projects often differ in the timing and distribution of their cash flows. Some projects generate large cash inflows early, while others produce smaller early returns followed by larger cash flows later. IRR tends to favor projects with early cash inflows because it focuses on the rate at which returns are generated. NPV, however, evaluates the total value of all discounted cash flows over the entire project life.
A project with quick early returns may rank higher under IRR, while a project with greater long term cash inflows may rank higher under NPV. This difference in focus leads to conflicting project rankings.
Unequal Project Durations
Projects may have different lifespans, with some lasting only a few years and others extending over a longer period. IRR often favors shorter projects because returns are realized more quickly and reinvested sooner. NPV accounts for the full duration of each project by discounting all cash flows at the required rate of return.
Shorter projects may show higher IRRs but lower NPVs, while longer projects may generate higher total value. This difference causes NPV and IRR to rank projects inconsistently.
Multiple IRRs Caused by Unconventional Cash Flows
Unconventional cash flows occur when a project has more than one change in the direction of cash flows, such as additional investments after operations begin. In these cases, the IRR calculation may produce more than one IRR or no meaningful IRR at all.
Multiple IRRs make interpretation difficult and can lead to misleading rankings. NPV does not suffer from this problem because it always provides a single, clear value at a given discount rate.
Differences in Reinvestment Assumptions
NPV assumes that intermediate cash flows are reinvested at the cost of capital, which reflects realistic market conditions. IRR assumes reinvestment at the project’s internal rate of return, which may be unrealistically high, especially for projects with very high IRRs.These different reinvestment assumptions can cause IRR to overestimate the attractiveness of certain projects, leading to rankings that differ from those based on NPV.
How Students Should Address Ranking Differences
Emphasize NPV When Project Sizes Differ
When projects require different initial investments, NPV is the more appropriate metric because it measures absolute value creation. Students should explain that a project with a lower IRR may still be preferable if it produces a higher NPV and adds more total value.
Use Scenario and Sensitivity Analysis
Scenario analysis examines how project rankings change under different assumptions, such as higher or lower discount rates or changes in cash flow estimates. Sensitivity analysis shows how sensitive NPV and IRR are to changes in key variables. These tools help explain why rankings differ and demonstrate deeper analytical thinking.
Justify the Appropriate Metric for the Context
High quality assignments clearly justify why one evaluation method is more suitable than the other. Students should link their choice of NPV or IRR to the decision context, such as project scale, risk, capital constraints, or strategic objectives.
Read Also: How Neoliberal Capitalism Thrives on Inequality
4. Project Selection Criteria: When to Use NPV vs. IRR
Choosing between Net Present Value (NPV) and Internal Rate of Return (IRR) depends on the context of the investment decision. While both methods are important in capital budgeting, they serve different purposes and are most effective in different situations. Understanding when to rely on NPV and when IRR can provide useful support is essential for both basic business studies and advanced academic analysis.
Situations Where NPV Is Preferred
Mutually Exclusive Projects
When projects are mutually exclusive, only one project can be selected, and choosing one means rejecting the others. In this situation, NPV is the preferred decision tool because it measures the absolute value added by each project. Selecting the project with the highest NPV ensures that the decision maximizes total value rather than focusing on percentage returns.
Different Initial Investment Sizes
Projects often require different levels of initial investment. IRR can be misleading in these cases because smaller projects may show higher percentage returns even though they generate less total value. NPV accounts for the scale of investment and shows how much value each project adds in monetary terms, making it more reliable when investment sizes differ.
Long Term Strategic Investments
For projects that support long term growth, expansion, or strategic objectives, NPV is more appropriate because it captures the full value of cash flows over the entire project life. It also aligns with long term planning by using the cost of capital as the discount rate, reflecting realistic financing conditions.
Goal of Maximizing Shareholder Wealth
The primary financial objective of most firms is to maximize shareholder wealth. NPV directly supports this goal by measuring how much wealth a project creates or destroys. A positive and higher NPV indicates greater value creation, making NPV the most consistent tool for value based decision making.
Situations Where IRR Is Useful
Capital Rationing or Budget Constraints
When firms face limited capital and cannot undertake all positive NPV projects, IRR can help rank projects based on their efficiency or return per unit of investment. This is useful when deciding how to allocate scarce resources among competing investment opportunities.
Comparing Projects with Similar Scale
IRR is more meaningful when comparing projects that have similar initial investments and similar risk profiles. In these cases, percentage returns provide a clear comparison of performance without being distorted by differences in project size.
Communicating Performance to Non Financial Stakeholders
IRR is expressed as a percentage, which makes it easier to understand for managers, investors, and stakeholders who may not have a strong finance background. It is often used in presentations and reports to communicate project performance in a simple and intuitive way.
Best Practice in Capital Budgeting
Best practice in finance is to use IRR as a supporting metric rather than the primary decision rule. NPV should guide final project selection because it measures value creation directly. IRR should be used alongside NPV to provide additional insight into returns, efficiency, and comparative performance.
5. How to Calculate NPV and IRR Step by Step
Calculating Net Present Value (NPV) and Internal Rate of Return (IRR) involves a structured process that helps evaluate whether an investment project is financially viable. The steps below explain the procedure clearly, using concepts that are accessible to beginners while remaining rigorous enough for advanced academic work.
Step 1: Estimate Cash Flows
The first step in calculating both NPV and IRR is to identify and estimate all relevant cash flows associated with the project. This includes the initial investment, which is usually a cash outflow at the start of the project, as well as future operating cash inflows generated during the project’s life. Terminal values, such as salvage value or final recovery of working capital, should also be included where applicable. Accurate cash flow estimation is critical because errors at this stage will affect both NPV and IRR results.
Step 2: Calculate NPV
To calculate Net Present Value, each future cash flow is discounted back to its present value using the cost of capital or required rate of return. This reflects the time value of money, recognizing that a dollar received today is worth more than a dollar received in the future. The present values of all future cash flows are then summed and the initial investment is subtracted. A positive NPV indicates that the project is expected to create value, while a negative NPV suggests value destruction.
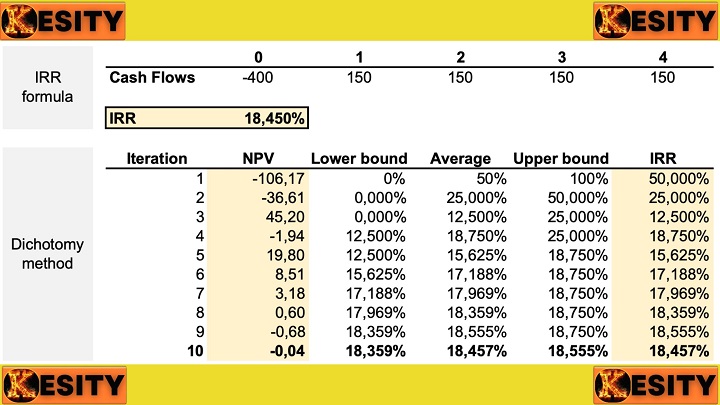
Step 3: Calculate IRR
Internal Rate of Return is calculated by finding the discount rate at which the project’s NPV equals zero. This rate represents the project’s expected percentage return. In practice, IRR is usually calculated using financial calculators, spreadsheet software such as Excel with the IRR function, or an iterative trial and error approach where different discount rates are tested until NPV equals zero. IRR can be more complex to compute manually, but technology makes the process straightforward.
Step 4: Interpret Results Together
Once both NPV and IRR have been calculated, the results should be interpreted together rather than in isolation. A project with a positive NPV and an IRR greater than the cost of capital is generally acceptable, as it creates value and exceeds the required rate of return. When NPV and IRR give conflicting signals, deeper analysis is required. Students should explain the reasons for the conflict by considering factors such as cash flow timing, project size, risk, and reinvestment assumptions.
Key Learning Point
For academic assignments and real world decision making, the strength of the analysis lies not only in performing correct calculations but also in clearly explaining what the NPV and IRR results mean. Demonstrating an understanding of both the numerical outcomes and the financial logic behind them is essential for high quality work at all levels of study.
Read Also: What is the Role of Profitability Index in Capital Budgeting
6. Real-World Scenarios Where NPV and IRR Differ
In practical investment analysis, it is common to encounter situations where Net Present Value (NPV) and Internal Rate of Return (IRR) lead to different conclusions about the same project. These differences arise because each method evaluates cash flows and returns from a different perspective. Understanding these real world scenarios helps students apply capital budgeting techniques more effectively in both academic and professional settings.
Uneven Cash Flows
Some projects involve uneven or irregular cash flows, where large returns occur far into the future rather than evenly over time. Long term infrastructure projects, research investments, or technology development projects often fall into this category. NPV captures the full value of these future cash flows by discounting them appropriately, which can result in a strong positive NPV. IRR, however, may appear lower because returns are delayed and spread over a longer period.
Why Results Differ
IRR is sensitive to how quickly returns are generated, while NPV focuses on total value created. As a result, projects with delayed but substantial cash inflows may look less attractive under IRR even though they create significant value according to NPV.
Mutually Exclusive Projects
When projects are mutually exclusive, only one option can be chosen. These projects often differ in size, timing of cash flows, and initial investment requirements. NPV evaluates which project adds the most total value, while IRR compares relative percentage returns.
Results Differ Because
A smaller project may show a higher IRR due to efficient use of capital, while a larger project may produce a higher NPV by generating greater total cash inflows. This difference leads to ranking conflicts between NPV and IRR.
Different Project Lifespans
Projects frequently have different durations, with some lasting only a few years and others extending over many years. IRR tends to favor shorter projects because returns are realized and reinvested sooner. NPV accounts for the entire lifespan of the project by discounting all cash flows over time.
Why Results Differ
Short term projects may rank higher under IRR even if they generate less total value. Longer projects may appear less attractive under IRR but produce higher NPVs due to their sustained cash inflows.
Project Expansion and Scaling
Expanding or scaling a project changes the magnitude and sometimes the timing of cash flows. A scaled up project may require additional investment, which can lower the IRR because the percentage return declines. However, the total cash inflows may increase significantly, leading to a higher NPV.
Results Differ Because
NPV adjusts naturally for changes in project size and continues to measure total value creation. IRR, expressed as a percentage, may decline even when a project becomes more valuable. This highlights why value based decision making relies more heavily on NPV than IRR.

7. Best NPV and IRR Assignment Help Websites
Students studying capital budgeting, financial management, or investment analysis may sometimes need additional guidance beyond textbooks and lectures. NPV and IRR assignments often involve complex calculations, interpretation of results, and application to real world scenarios. The following platforms are commonly used by students seeking structured NPV and IRR assignment help, worked examples, and academic clarification.
kessays.com
Kessays.com provides professional academic assistance across finance and business subjects. For NPV and IRR assignments, the platform offers support with capital budgeting concepts, step by step calculations, and structured explanations that align with university marking criteria. It is particularly useful for students who need help understanding how to present financial analysis clearly in written assignments.
peachessay.com
Peachessay.com specializes in assignment support and offers expert help with NPV and IRR calculations, Excel based analysis, and interpretation of financial results. The platform is useful for students who struggle with numerical finance problems and need clear guidance on applying formulas correctly and explaining results in an academic format.
kector.com
Kector.com is a trusted academic support platform that covers a wide range of finance topics, including investment appraisal and capital budgeting techniques. It is suitable for students seeking conceptual explanations of NPV and IRR, as well as practical examples that demonstrate how these methods are applied in real business decisions.
myassignmenthelp.com
Mysassignmenthelp.com offers specialized assistance in capital budgeting and financial management assignments. It supports students with detailed solutions, explanations of decision rules, and guidance on resolving NPV versus IRR conflicts. This platform can be helpful for higher level coursework where analytical depth and justification are required.
While assignment help websites can be valuable learning resources, students should use them to improve understanding rather than as substitutes for independent study. Strong academic performance depends on grasping the underlying concepts of NPV and IRR, explaining reasoning clearly, and applying financial logic correctly in exams and coursework.
Conclusion
Net Present Value and Internal Rate of Return are foundational tools in capital budgeting, financial decision making, and academic finance coursework. While both methods are used to evaluate project viability and investment performance, they are based on different assumptions regarding cash flow timing, reinvestment rates, and project scale. As a result, NPV and IRR can sometimes produce conflicting conclusions, particularly when analyzing mutually exclusive projects or investments with uneven cash flows.
A strong academic response goes beyond performing correct calculations. It demonstrates the ability to interpret NPV and IRR results critically, explain why differences occur, and justify the use of one method over the other based on the decision context. By understanding the strengths, limitations, and appropriate applications of NPV and IRR, students can approach assignments with greater confidence, produce clearer and more rigorous analyses, and develop financial decision making skills that are applicable not only in the classroom but also in real world business and investment environments.
Comments are closed!